Follow up on my previous two posts (Smart Sizing part 1 and Smart Sizing part 2), I wanted to follow up with a couple real-life examples and hopefully illustrate why it is important to at least try to get a handle on your collected data. As mentioned in the previous posts, it is important not to simply accept an average from the data collection – rather it is worth the extra time to try to understand what is there, what the upper bounds are, and whether all the workloads identified in the collection will actually be candidates for migration.
Example 1 – Relocating Cluster Workloads
In my first example, one of my customers needed to relocate a number of workloads off an aging UCS cluster. They wanted to see if they could gain any efficiencies and possibly save some money by migrating those cluster workloads to VMware Cloud on AWS.

Not an enormous environment, to be sure, however when I ran an initial sizing on all the 164 powered-on virtual machines, it required (29) i3.metal instances! This is larger than their previous environment, which was even a stretched cluster – so clearly some additional analysis was needed.
The very fist thing I did was to quickly sort by consumed storage to begin to get an idea of the ‘storage outliers’ – which produced a list of the following:
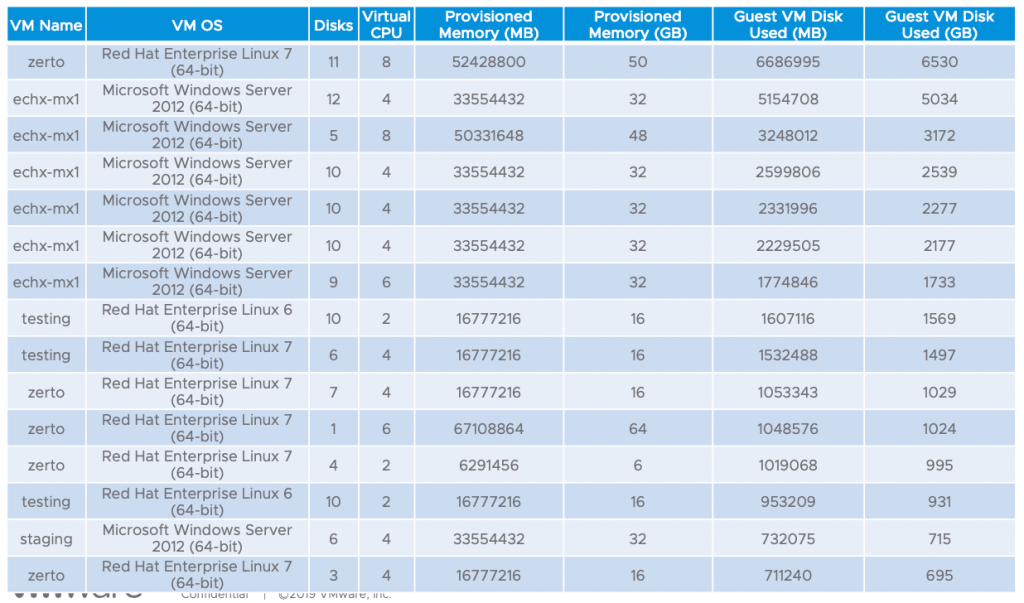
As you can see, those were mostly all Zerto replication appliances, and Exchange mailbox servers – neither of which would be migrated to the cloud. The Zerto appliances only perform replication, so there is no reason to migrate them, and the customer is not yet ready to do anything with their on-prem Exchange implementation.
Together we went through the remaining workloads and identified a few dozen more workloads that would not be move – either they are appliances that are running that would serve no purpose in the cloud, or they are applications that would not be moved for other reasons. In the end, we ended up with only 112 workloads.
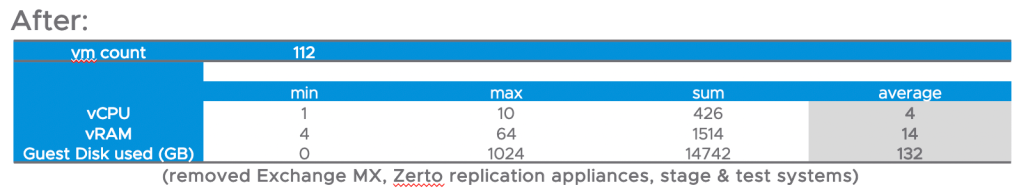
I built profiles for them with an Excel pivot table:

And then ran those profiles through the VMC sizer.
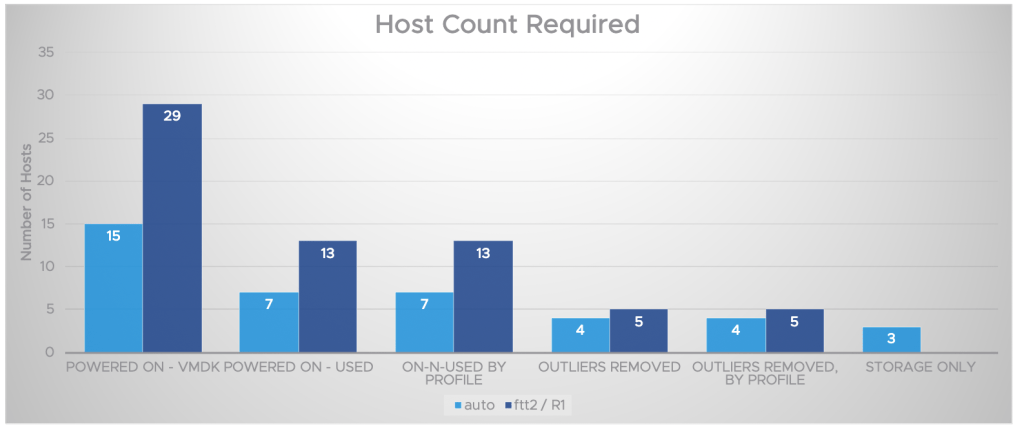
You can see that I ran scenarios for:
- powered on virtual machines with configured storage
- powered on virtual machines with only used storage
- powered on virtual machines with only used storage – by profile
- powered on virtual machines with only used storage – with the outliers removed
What began as an exercise showing initially that I would need 29 hosts, in the end I only needed 5.
Example 2 – Datacenter Evacuation
In this example, one of my customers was trying to wrap some financials around eliminating an entire datacenter, and moving everything to VMware Cloud on AWS. You can see a summary of their environment in the table below.

Similar to the example above, I went through their environment, removed virtual machines that were powered off, and identified the top consumers of storage. I reviewed this list with the customer, and we agreed to ultimately pull about 400 virtual machines out of the inventory – just about 10% of the environment were identified as non-candidates for migration. The summary of the remaining virtual machines is below.

I built a pivot table in Excel to group these remaining workloads broadly into categories based on their VM configuration as below.

Once again, I ran multiple sizing scenarios – you can see I began with the summary information for all the virtual machines – trying to migrate everything into the cloud would have required a whopping 242 i3.metal hosts, or nearly 70 r5.metal hosts!
However, by pulling out the powered off virtual machines, and by simply having a conversation with the IT director to identify workloads that can’t / won’t move – the required host count drops dramatically – all the way down 75 i3.metal hosts, or 47 r5.metal hosts. The final configuration for just using the cloud as a ‘pilot light’ for DR only required 22 r5.metal hosts (in this case, the workloads are storage-bound on the i3.metal, which is why the host count for the i3.metal nodes doesn’t change for the last 2 scenarios).

Conclusion
Hopefully this series has given you some things to consider when looking at an environment and trying to figure out how to size new infrastructure for it. The major lesson for me has been simply not to accept a simple average of all the data – it is absolutely necessary to break it down, understand which workloads are skewing the data, which workloads may not move at all, and then break it down further by workload type. In my examples above, I simply built profiles based on virtual machine sizing (by vCPU) – but it is equally valid to group different types of workloads together – databases, virtual desktops, file / print servers, web servers, etc.
Tweet / reply / share if you like or have additional insights you would like to share!

One comment